Chapter 1.2.4.1 Estimating Discrete Distributions
In this section, we show how to estimate via simulation the pmf of a discrete random variable. Let’s begin with an example.
Example Suppose that two dice are rolled, and their sum is denoted as X. Estimate the pmf of X via simulation.
Recall that if we wanted to estimate the probability that X = 2, for example, we would use
mean(replicate(10000, {dieRoll <- sample(1:6, 2, TRUE); sum(dieRoll) == 2}))
## [1] 0.0268
It is possible to repeat this replication for each value 2,…,12, but that would take a long time. More efficient is to keep track of all of the observations of the random variable, and divide each by the number of times the rv was observed. We will use table for this. Recall, table gives a vector of counts of each unique element in a vector. That is,
table(c(1,1,1,1,1,2,2,3,5,1))##
## 1 2 3 5
## 6 2 1 1indicates that there are 6 occurrences of “1”, 2 occurrences of “2”, and 1 occurrence each of “3” and “5”. To apply this to the die rolling, we create a vector of length 10,000 that has all of the observances of the rv X, in the following way:
set.seed(1)
table(replicate(10000, {dieRoll <- sample(1:6, 2, TRUE); sum(dieRoll)}))
##
## 2 3 4 5 6 7 8 9 10 11 12
## 265 556 836 1147 1361 1688 1327 1122 853 581 264We then divide each by 10,000 to get the estimate of the pmf:
set.seed(1)
table(replicate(10000, {dieRoll <- sample(1:6, 2, TRUE); sum(dieRoll)}))/10000
##
## 2 3 4 5 6 7 8 9 10 11
## 0.0265 0.0556 0.0836 0.1147 0.1361 0.1688 0.1327 0.1122 0.0853 0.0581
## 12
## 0.0264And, there is our estimate of the pmf of X. In particular, we estimate the probability of rolling an 11 to be 0.0581.
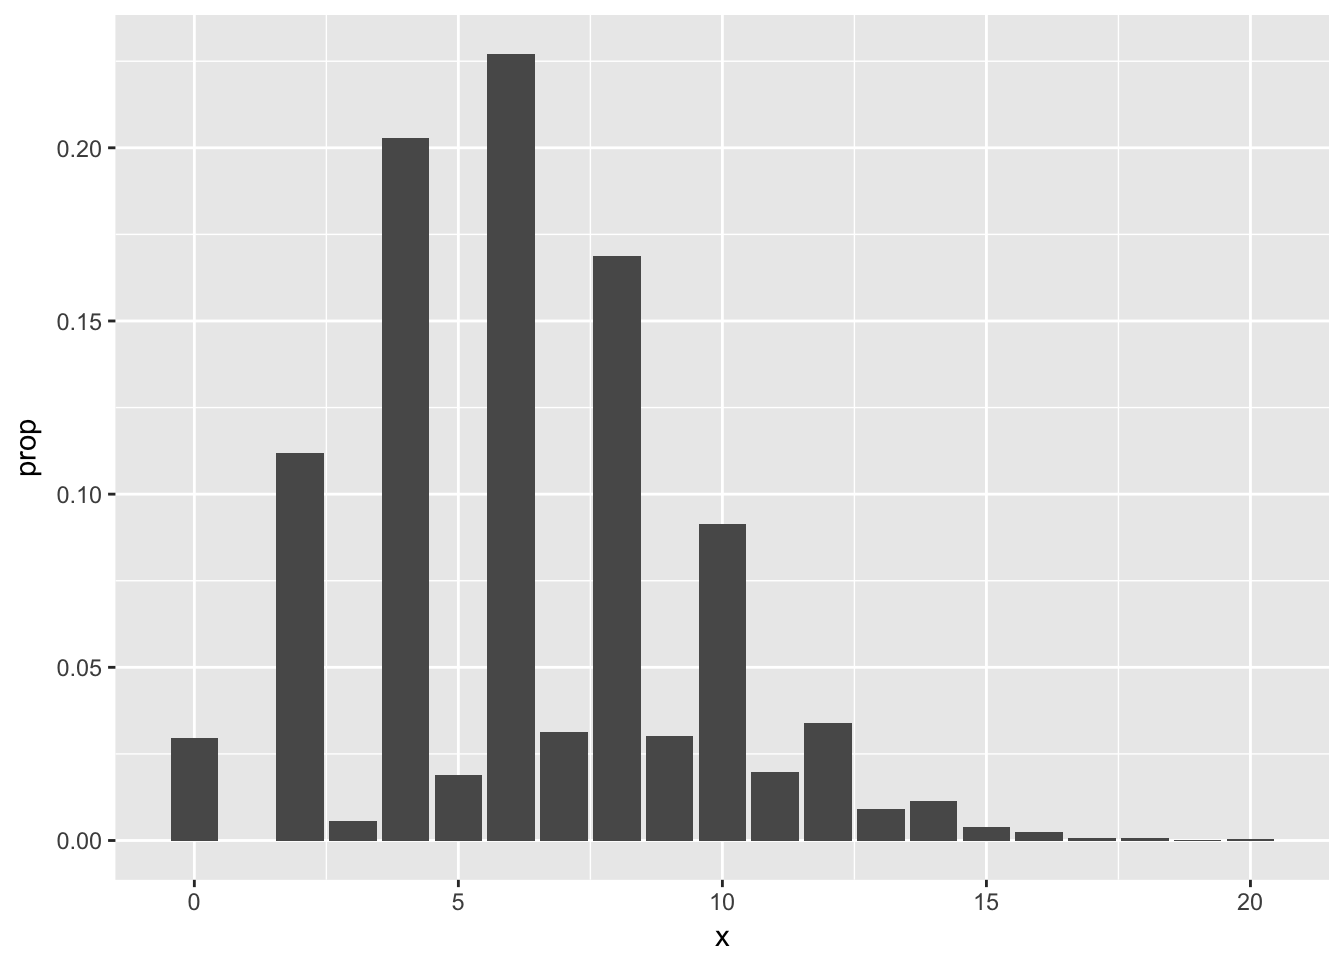
Example Suppose fifty randomly chosen people are in a room. Let X denote the number of people in the room who have the same birthday as someone else in the room. Estimate the pmf of X.
We will simulate birthdays by taking a random sample from 1:365 and storing it in a vector. The tricky part is counting the number of elements in the vector that are repeated somewhere else in the vector. We will create a table and add up all of the values that are bigger than 1. Like this:
birthdays <- sample(1:365, 50, replace = TRUE)
table(birthdays)
## birthdays
## 9 20 26 28 33 38 42 43 44 54 55 57 64 74 77 99 110 112
## 1 1 1 1 1 1 1 1 1 1 1 1 1 1 1 1 1 1
## 113 114 116 127 140 144 147 148 165 168 169 171 175 184 193 233 239 240
## 2 1 1 1 1 1 1 1 1 1 1 1 1 1 1 1 1 1
## 249 257 268 272 274 280 289 295 303 304 328 354 362
## 1 1 1 1 1 1 1 1 1 1 1 1 1We look through the table and see that anywhere there is a number bigger than 1, there are that many people who share that birthday. To count the number of people who share a birthday with someone else:
sum(table(birthdays)[table(birthdays) > 1])## [1] 2Now, we put that inside replicate, just like in the previous example.
set.seed(1)
birthdayTable <- table(replicate(10000, {birthdays <- sample(1:365, 50, replace = TRUE); sum(table(birthdays)[table(birthdays) > 1]) }))/10000
birthdayTable
##
## 0 2 3 4 5 6 7 8 9 10
## 0.0297 0.1118 0.0056 0.2029 0.0190 0.2271 0.0312 0.1687 0.0301 0.0914
## 11 12 13 14 15 16 17 18 19 20
## 0.0198 0.0338 0.0092 0.0115 0.0038 0.0025 0.0007 0.0007 0.0001 0.0004Looking at the pmf, our best estimate is that the most likely outcome is that 6 people in the room share a birthday with someone else, followed closely by 4 and then 8. Note that it is impossible for exactly one person to share a birthday with someone else in the room! It would be preferable for several reasons to have the observation P(X=1)=0P(X = 1) = 0 listed in the table above, but we leave that for another day. Plotting the pmf from the table output is a little more complicated than we need to get into right now (see Section 6.4), but here is a plot.3